
2018-19 National Treasures Basketball Set Analysis
Please see below for the 2018-19 National Treasures Basketball Set Analysis.
Interesting Points:
– OKC has zero autos, but Seattle Supersonics have 420
– Amar`e Stoudemire, Tyreke Evans, Michael Redd, Steve Francis and Yao Ming only have one card in the release, the Colossal Logoman…
– There are 48 players with RPAs including Allonzo Trier, Mitchell Robinson, Chimezie Metu, Kostas Antetokounmpo, Rodions Kurucs and Yuta Watanabe meaning the Knicks and Nets are a great chance at an RPA in case breaks
– Every Player has 212 total RPAs inclduing the Vertical, Horizontal, FOTL and Logoman Variations with the following hit ratios for each:

Set Summary by Team:
Below is a PDF summarising each hit by team and card set:
2018-19 National Treasures Basketball Set Summary Document by Team
Case Breakdown (On Average):
- 4 Boxes per Case
- 1 Packs per Box
- 10 Cards per Box
- 8 Autos or Memorabilia per Box
- 1 Base Card per Box
- 1 Printing Plate per Box
Detailed Breakdown (Raw Checklist Numbers in Brackets)
-> ~1 Numbered Base per Box [1.02]
-> ~2 Autos per Box [2.11]
-> ~4 Memorabilia per Box [4.03]
-> ~2 Auto + Memorabilia per Box [1.84]
2018-19 National Treasures Basketball Set Analysis:
Total #d Cards: 136272
Total # Base Cards: 15400 (11.3% of #d Cards)
Total # Autos: 32023 (23.5% of #d Cards)
Total # Memorabilia Cards: 61024 (44.8% of #d Cards)
Total # Auto + Memorabilia Cards: 27825 (20.4% of #d Cards)
Total # Boxes/Cases:
136,272 numbered base cards in the set
-> Cards per Case = 36 (excluding printing plates which are not included in the checklist)
-> 136,272 / 36 Cards per Case = 3785.55 cases
-> Assume 3,750 cases
Card Set Hit Ratios:
-> 1/1s = 0.38 per case (1 in every 2.67 cases) / 0.09 per box (1 in every 10.66 boxes)
-> RPA (All excl FOTL) = 2.44 per case (1 in every 0.41 cases) / 0.61 per box (1 in every 1.64 boxes)
-> RPA (/99) = 1.28 per case (1 in every 0.78 cases) / 0.32 per box (1 in every 3.11 boxes)
-> RPA (/10) = 0.13 per case (1 in every 7.71 cases) / 0.03 per box (1 in every 30.83 boxes)
-> RPA (/5) = 0.06 per case (1 in every 15.42 cases) / 0.02 per box (1 in every 61.67 boxes)
-> Logoman (All inc Rookies) = 0.1 per case (1 in every 9.71 cases) / 0.03 per box (1 in every 38.85 boxes)
-> Logoman Auto (Including Rookies) = 0.02 per case (1 in every 44.58 cases) / 0.01 per box (1 in every 178.31 boxes)
-> Rookie Logoman (All) = 0.07 per case (1 in every 14.92 cases) / 0.02 per box (1 in every 59.68 boxes)
-> Card #’d 25 or less = 8.85 per case (1 in every 0.11 cases) / 2.21 per box (1 in every 0.45 boxes)
-> Card #’d 10 or less = 2.75 per case (1 in every 0.36 cases) / 0.69 per box (1 in every 1.45 boxes)
-> Card #’d 5 or less = 1.07 per case (1 in every 0.93 cases) / 0.27 per box (1 in every 3.73 boxes)
Total # of Hits by Team(#d Cards)
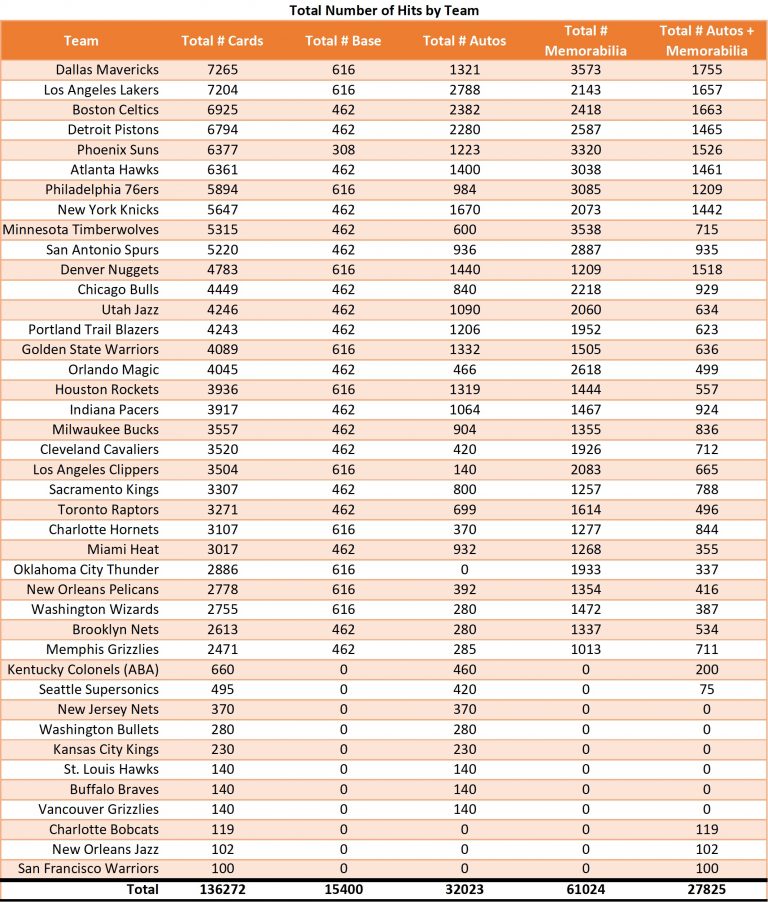 Interactive List
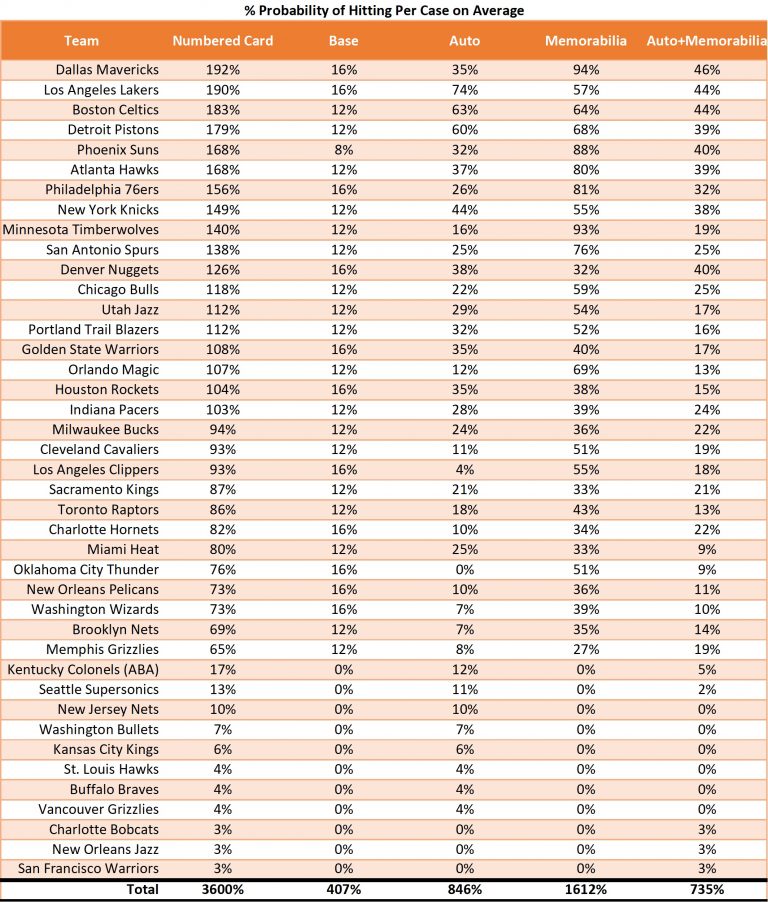
Teams % Chance of Hit (#d Card) / Case
Top 50 Players by Total # of Hits (#d Cards)
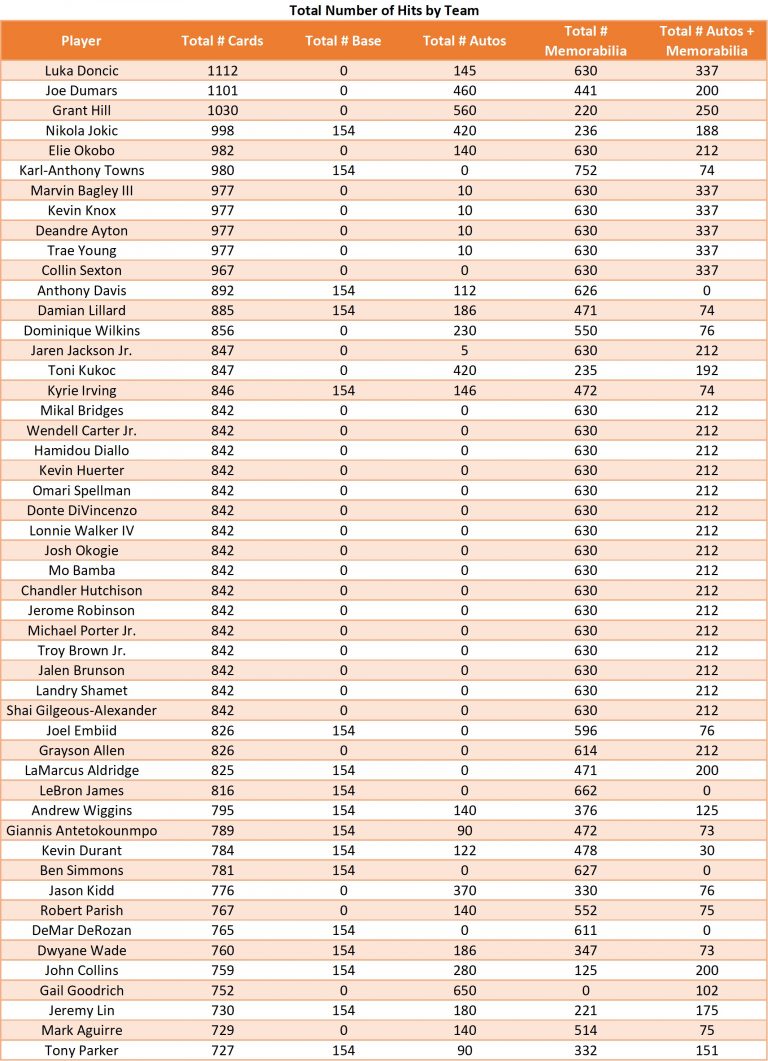 Full List
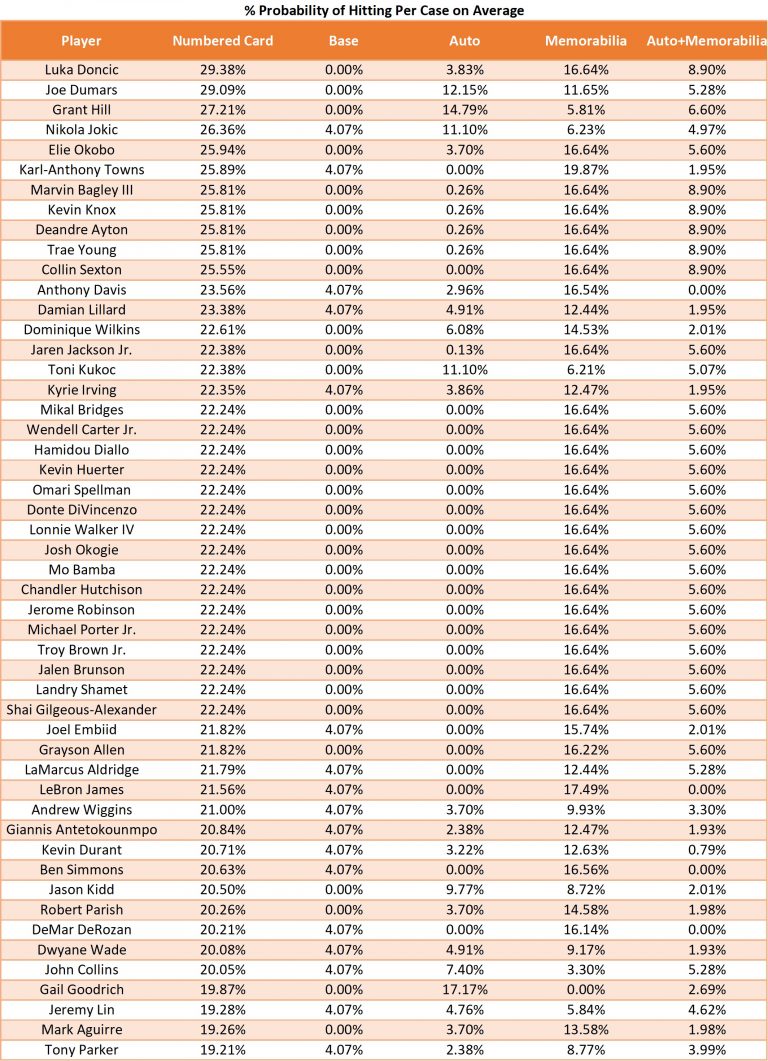
Top 50 Players % Chance of Hit (#d Card) / Case
PLEASE NOTE:
The figures and information presented above are based purely on the number of cards per box/case on average. The values presented per player and per team are not guaranteed to be reflected in every case, instead they represent the average odds for all cases produced. They do not take into account variations in these numbers or the methods/processes used to package the product. All data presented here has been derived from the Panini checklist for the product and therefore all errors present in the checklists will be present in the figures above. This data is for information only and should not be considered authoritative in any way.


